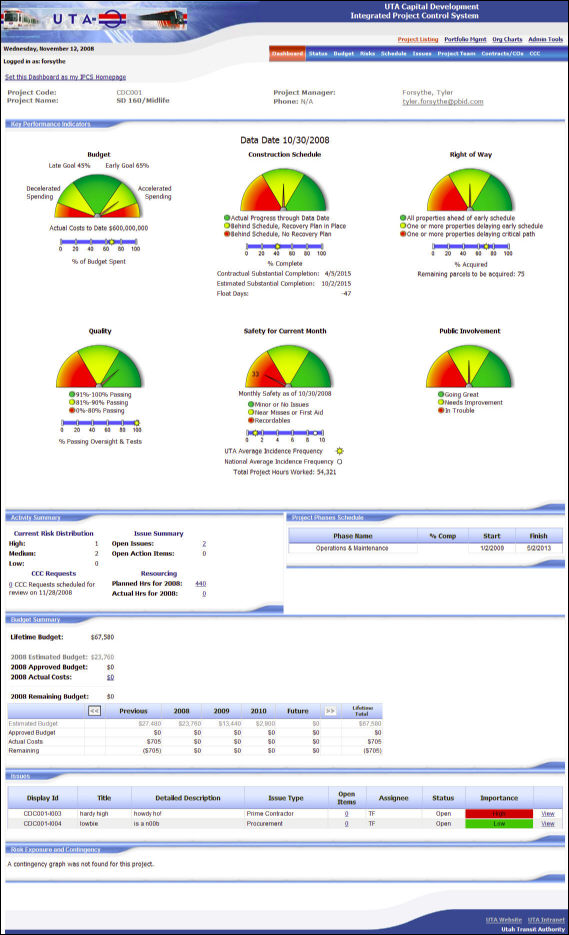
The ”Project Listing - Dashboard” view appears when the user selects the ”Dashboard” option under ”Project Listing”. This page provides the user with a central, dashboard-style view of the inner workings of the project they have selected. All information identified as significant to the management and operation of a selected UTA project is shown here at a summary level, allowing users to quickly understand the overall status of that project.
IPCS Project "Dashboard" Screen
Immediately upon opening the dashboard the user will be presented with a series of Key Performance Indicators dials:
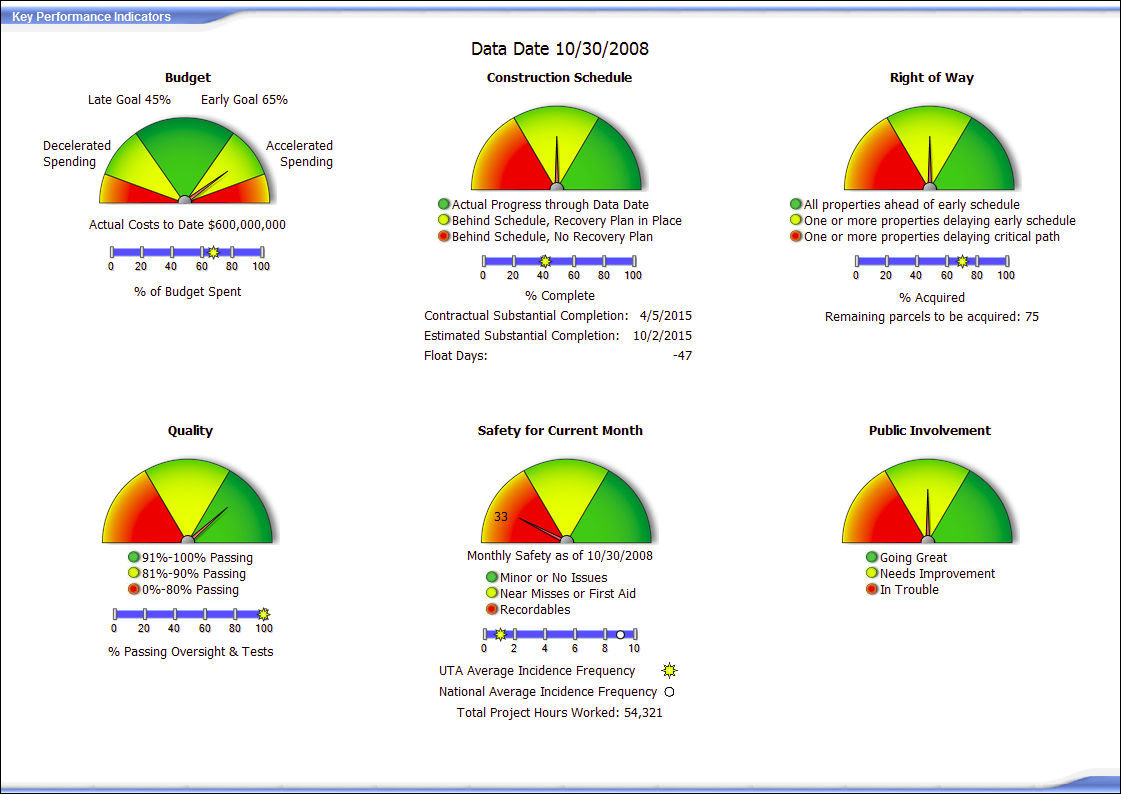
IPCS Project Listing Dashboard "Key Performance Indicators" Dials Screen
Each of these dials represents a separate Key Performance Indicator (KPI) of the project and conveys a status for the project related to that item:
Budget - this KPI provides a quick summary status for the project budget indicating both the percentage of the total budget spent and a general reflection of the actual spending compared to the anticipated amount of spending forecasted. ("Decelerated Spending" indicates that less money has been spent then was budgeted, "Accelerated Spending" indicates that more money has been spent then was budgeted, and the green area between the two would indicate "On Budget".)
Construction Schedule - this KPI indicates how the project schedule is progressing. (Green indicates that the project is "On Schedule", yellow indicates that the project is "Behind Schedule" but is recoverable, and red indicates that the project is "Behind Schedule" but the lost time is not recoverable.)
Right of Way - this KPI indicates how the Right-of-Way acquisitions are progressing for this project as well as the total percentage that have been acquired. (Green indicates that all property acquisitions are ahead of early schedule, yellow indicates that one or more properties are delaying the early schedule, where red indicates that one or more properties are delaying the critical path.)
Quality - this KPI reflects the status of the quality assurance measures being used on this project. (Green indicates that 91% or more of the status checks conducted have been "passing", yellow indicates that between 81% and 90% of the conducted quality tests have been "passing", where as the red area of the dial indicates that the project has 80% or fewer "passing" quality checks recorded.)
Safety for Current Month - this KPI indicates tracks the number of safety related issues reported on the project for the current month, as well as the total number of hours worked to date on the project and a comparison to the national average for safety. (Green indicates that there have only been minor or no issues reported for the project this month, yellow indicates that the project recorded one or more "Near Misses" or incidents requiring "First Aid", and red indicates that the project has had one or more "Recordable" incidents that had to be reported to UTA and associated safety officials.)
Public Involvement - this KPI is a reflection of the general feeling being reflected in comments by the public related to this project. (Green indicates that the project is "Going Great", yellow indicates that the project "Needs Improvement", and red indicates that the project is "In Trouble" in the minds of the participating public.)
Another section of the Project Listing Dashboard is the "Activity Summary" area. Each of the items shown in the ”Activity Summary” area contains one or more linkage points that provide users with access to more detailed information related to the specific item they are looking at.
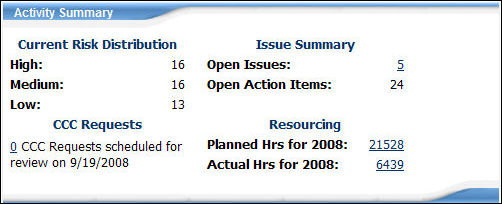
IPCS "Activity Summary" area (in detail)
The reason that this page is referred to as a ”dashboard” view of the project is that it has been designed to provide the reader with a quick understanding of multiple areas of the project at the same time, in the same way that looking at the dashboard of your car will provide you with multiple pieces of information related to the health of your vehicle at a single glance.
From the ”Dashboard” view, the reader can quickly view summary data about specific areas of the selected project including:
Project Code
Project Name
Project Manager name and contact info
Project Risk Summaries
Project Issues
Project Change Requests
Project Resources
Project Schedule
Budget Summary
To view the detailed information for these areas, the user must click on the corresponding links located within the ”Dashboard” page or within the button bar menu at the top of the screen.

IPCS Project Listing Button Bar
In addition to the ”Dashboard” view, depending on their security profile, users may access other detailed project information including:
Users also have the option of identifying the ”Dashboard” page for any project as their default page in IPCS by clicking on the ”Set this Dashboard as my IPCS Homepage” link at the top of the page.
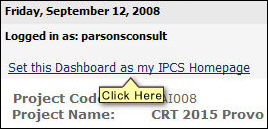
The ”Set this Dashboard as my IPCS Homepage” link
 Click here to see
a video of this process
Click here to see
a video of this process
<< IPCS Administration | Project Status >>