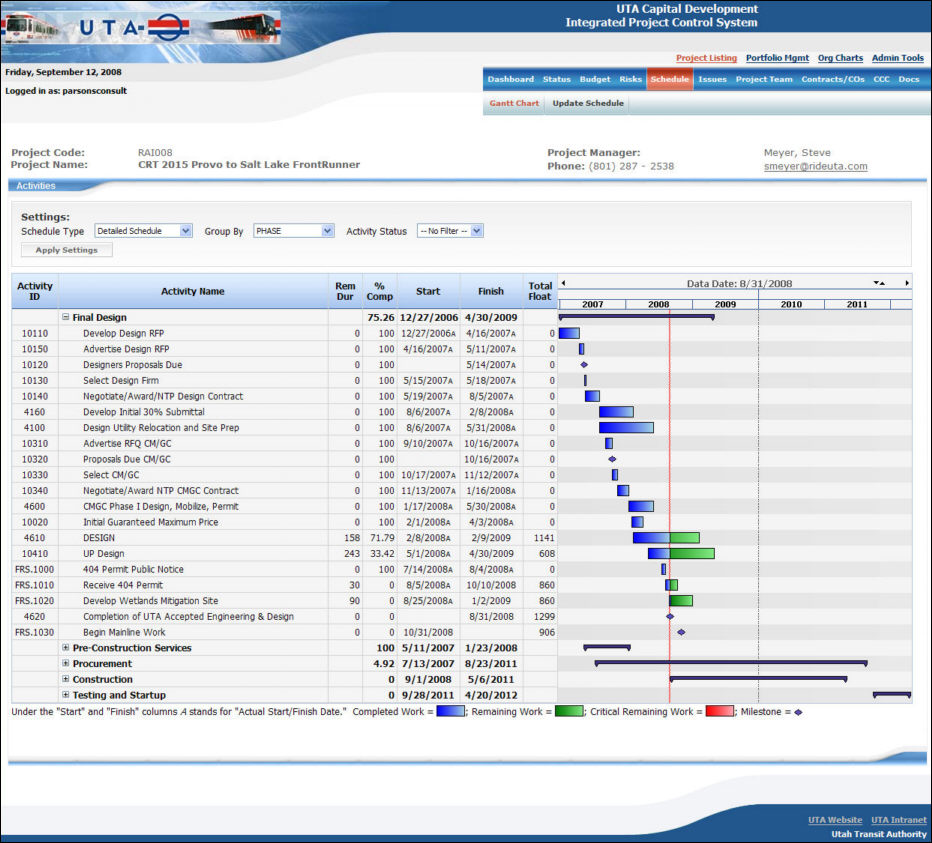
The ”Schedule” link under ”Project Listing” provides a detailed, graphical view of the current schedule information for a project in the form of activities and a Gantt chart. Users can change the settings of the chart so that it provides the type of data that is important to them.
”Project Schedule – Gantt Chart” Page
Users can change the Schedule type that is shown to display either:
Detailed Schedule
Summary Schedule
Six-Week Look Ahead
Critical Path, or
Project Milestones
The data presented can then be grouped logically to make it easier to work with. The user can group the data by one of the following:
FTA Code
Phase
Responsibility (Activity), or
No Grouping
The data can then be further restricted by filtering it to show only those activities with an ”Activity Status” equal to:
Not Finished
Not Started
In Progress
Finished, or
No Filter
Users can then mix and match these settings as needed to see the data results that they are interested in.
<< Project Risks | Project Issues >>